
Nagios
What is Nagios?
Nagios is a Monitoring tool used for IT Infrastructure Monitoring to maintain zero downtime for your Applications, Services, Systems, Databases and Business Processes etc. Nagios helps to detect failures and can be configured to alert technical staff so that the failures gets detected early and remediation process can be carried out before it affects entire Infrastructure or Customers.
Nagios Products
Nagios has four product according to your needs.
- Nagios XI
- Nagios Fusion
- Nagios Core
- Nagios Network Analyzer
- Nagios Log Server
You can find Demo of all this tools provides by official Nagios Website.
You can get Download this tools from here.
Nagios Core
Summary
Nagios core is free whereas other products of Nagios are paid tools. Nagios Core comes with less features compared with paid version of Nagios XI.
Benefits
The benefits you get from using Nagios Core are
- Monitoring
- Alerting
- Reporting
- Maintenace
- Planning
Features
- Visibility
- Reporting
- Proactive Planning
- Awareness
- Problem Remediation
- Comprehensive Monitoring
- Multi-Tenant Capabilities
- Extendable Architecture
If you want to know more visit Benefits and Features of Nagios Core.
Nagios Core Installation on Centos
I will be using Centos 8 minimal image for demonstration. For other distributions or OS refer to the following documetation.
Prerequisite
Disable SELinux as we dont need it for demonstration. You can configure it according to your needs.
sed -i 's/SELINUX=.*/SELINUX=disabled/g' /etc/selinux/config
setenforce 0
Check the current status of your SELinux mode using following command.
getenforce
The following dependencies are required for building and running nagios on you system.
dnf install -y gcc glibc glibc-common perl httpd php wget gd gd-devel
Instalation from Source -
Here I am using latest release version Nagios 4.4.6.
wget https://github.com/NagiosEnterprises/nagioscore/releases/download/nagios-4.4.6/nagios-4.4.6.tar.gz
tar -zxvf nagios-4.4.6.tar.gz
Now we have the source code on system lets compile it.
./configure && make all
We have now compiled the source code. Lets add the users to manage config files required for Nagios. The following make file creates nagios user and adds apache user in nagios group.
make install -groups-users
usermod -a -G nagios apache
Now, lets install HTML, CGI snf binary files and install Daemon or service.
make install
$ make install-daemoninit
We are ready with our service. You can enable service using
systemctl enable httpd.service
Lets install command mode and configuration files.
make install-commandmode
make install-config
make install-webconf
Now we need to update our firewall rules to access nagios dashboard on browser.
firewall-cmd --zone=public --add-port=80/tcp
firewall-cmd --zone=public --add-port=80/tcp --permanent
This will add rules to firewall config. make sure to use a correct port while configuring firewall. It’s time add authentication for accessing nagios dashboard in browser. I will be using Simple HTTP authentication here. Our nagios authentication will be stored in htpasswd.users file in encrypted format. The followed word nagiosadmin is our username for accessing dashboaed.
htpasswd -c /usr/local/nagios/etc/htpasswd.users nagiosadmin
This will prompt you for entering your password. Enter you password. It will again prompt you for confirmation of password just enter again the same password. We will now add httpd config file. You can get sample httpd file from sample-config folder inside extracted tar file. Copy that config file into httpd configuration.
cp sample-config/httpd.conf /etc/httpd/conf.d/
Now we will start both the services.
systemctl start nagios && systemctl start httpd
Open your browser and try to access nagios dashboard by http://
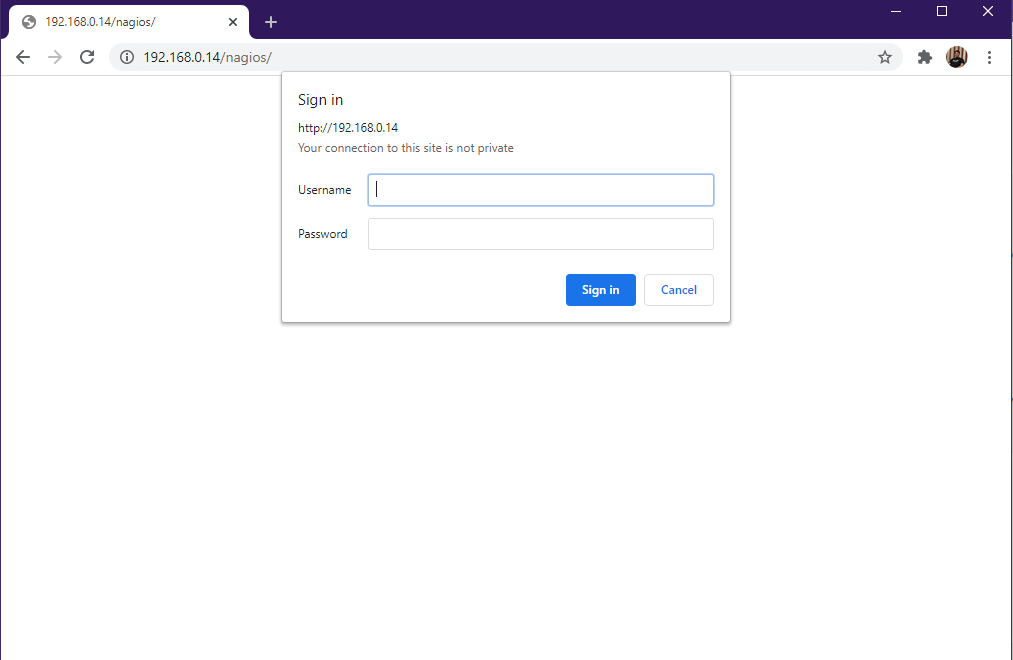
After entering credentials press enter and you will be presented with following Nagios Dashboard.

We have configured nagios successfully. In next posts I will demonstrate about installation of plugins and configuration of nagios for monitoring.